Idea and Concept

An easy way to realize monitoring in existing or new Java based software projects. This monitoring solution reduces the complexity of software monitoring to a minimum. Developers have only to configure the Simple Monitoring Plugin in Maven project file (pom.xml). It automatically analyzes the control flow respectively data flow of your software logic and remembers the method calls and exceptions as measurement values.

The plugin configuration provides the following opportunities:

  • definition of methods and classes, that should be tracked
  • choose if monitoring data will be saved local or at a central monitoring database
  • clear monitoring data
  • additional meta information about developer and department

Base Architecture

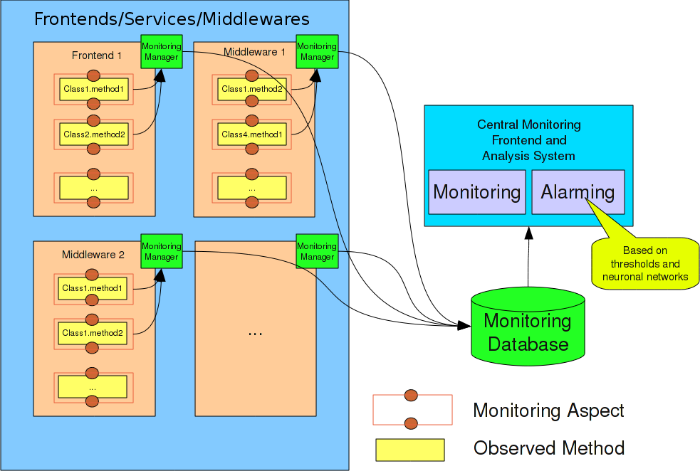
This plugin injects AOP based aspects at build time to existing source code. In runtime the first called and AOP tracked method, will instance the monitoring manager class. After that the monitoring configuration will be read and the tracking logic will be started.

Detail Architecture

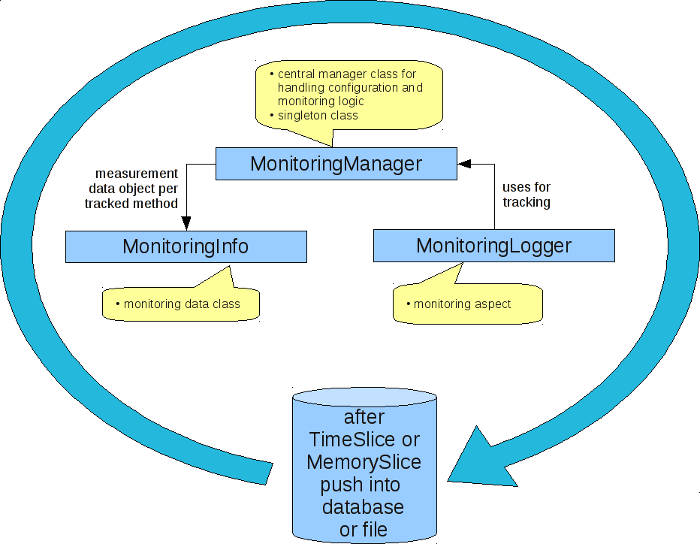
The MonitoringManager class represents the base class of the monitoring logic. It initialize the configuration and save all monitoring data at MonitoringInfo objects. The MonitoringLogger class is the Tracking AOP aspect, which will be weaved around defined methods.

AOP Code Injection Process

The MonitoringTrackerMojo class injects the tracking sources (MonitoringManager,MonitoringLogger,MonitoringInfo) to existing sources of your project.
  1. copy main monitoring classes
  2. adapt aspect file
  3. write properties file
  4. running ajc and weave choosen methods

Usage and Configuration

In maven project file pom.xml in build/plugins insert following section:

            <plugin>
                <groupId>org.developers.blog</groupId>
                <artifactId>monitoring-plugin</artifactId>
                <version>1.1.0-SNAPSHOT</version>
                <configuration>
                    <aopExpression>execution(* *.*(..))</aopExpression>
                    <useDB>true</useDB>
                    <department>My Test Department</department>
                    <team>Very Skilled Team</team>
                    <developers>f.mercury@domain.com</developers>
                    <complianceLevel>1.5</complianceLevel>
                    <verbose>true</verbose>
                    <debug>true</debug>
                    <showWeaveInfo>true</showWeaveInfo>
                    <memorySlice>50</memorySlice>
                    <timeSlice>20000</timeSlice>
                    <maxConnections>10</maxConnections>
                    <startThreadsCount>5</startThreadsCount>
                    <maxThreadsCount>20</maxThreadsCount>
                    <maxQueueCapacity>300</maxQueueCapacity>
                    <maxWaitTimeForConnection>60</maxWaitTimeForConnection>
                    <connectionPoolDataSourceClass>com.mysql.jdbc.jdbc2.optional.MysqlConnectionPoolDataSource</connectionPoolDataSourceClass>
                    <dbProperties>
                        <dbProperty>
                            <name>url</name>>
                            <value>jdbc:mysql://localhost/monitordb</value>
                        </dbProperty>
                        <dbProperty>
                            <name>user</name>
                            <value>dbuser</value>
                        </dbProperty>
                        <dbProperty>
                            <name>password</name>>
                            <value>secret</value>
                        </dbProperty>
                    </dbProperties>
                </configuration>
                <executions>
                    <execution>
                        <goals>
                            <goal>compile</goal>
                        </goals>
                    </execution>
                </executions>
            </plugin>
            

Parameter Explanation:

  • debug: true/false, a boolean flag specifying whether monitor plugin should write out debug infos on console
  • memorySlice: the maximum of method calls saved by one slice before it save data in monitoring database
  • timeSlice: time in sec before slice will save its data in monitoring database,
  • maxConnections: max. number of jdbc-connections in pool for saving data in monitoring database
  • startThreadsCount: number of threads at starting time in pool for saving monitoring data
  • maxThreadCount: max. number of threads in pool for saving monitoring data
  • maxQueueCapacity: max. capacity of queue with slices waiting for save
  • maxWaitTimeForConnection: max. waiting time in seconds for a free connection
  • connectionPoolDataSourceClass: class name of jdbc data source class, currently only MySql supported:
  • dbProperties: bean properties for data source definition as pair name and value
    • url: url address for monitoring database connection
    • user: dbuser login name
    • password: dbuser login password

Monitoring database

Currently is only MySql as RMDBS for monitoring plugin database supported. Sql script for creating of database is in file site/sql/mysql/create_table.sql